Visualising and analysing cell models#
The NeuroML ecosystem include a number of utilities for analysis and visualisation of cells. Cell morphologies can either be visualised programmatically using the core tools, or using the many advanced neuroinformatics tools in the ecosystem that support NeuroML. In addition to the resources listed below, you can also use the visualisation features of any other tools that read NeuroML. E.g., NetPyNE and NetPyNE-UI, neuroConstruct, Arbor and others.
Visualising morphology of multi-compartmental cell models#
Multi-compartmental cells can be visualised using the plot_2D and plot_interactive_3D methods included in pyNeuroML.
This functionality is also exposed via the pynml-plotmorph command line tool.
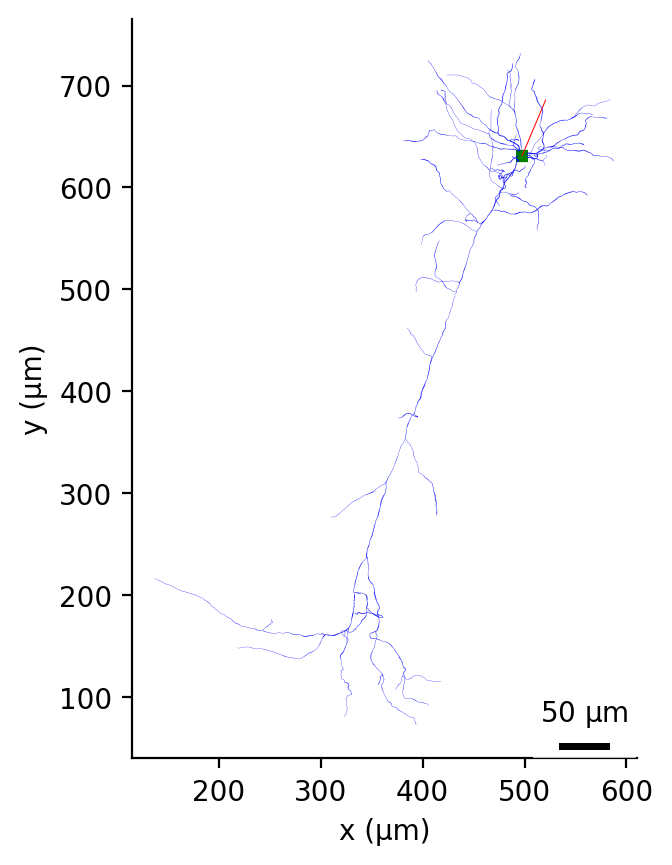
Fig. 37 Morphology of example cell plotted with plot_2D in the X-Y plane.#
Morphology of example cell visualised interactively using `plot_interactive_3D`
Visualising morphology of multi-compartmental cell models in NeuroML-db#
The NeuroML-DB platform shows detailed cell morphologies of all cells included in its database.
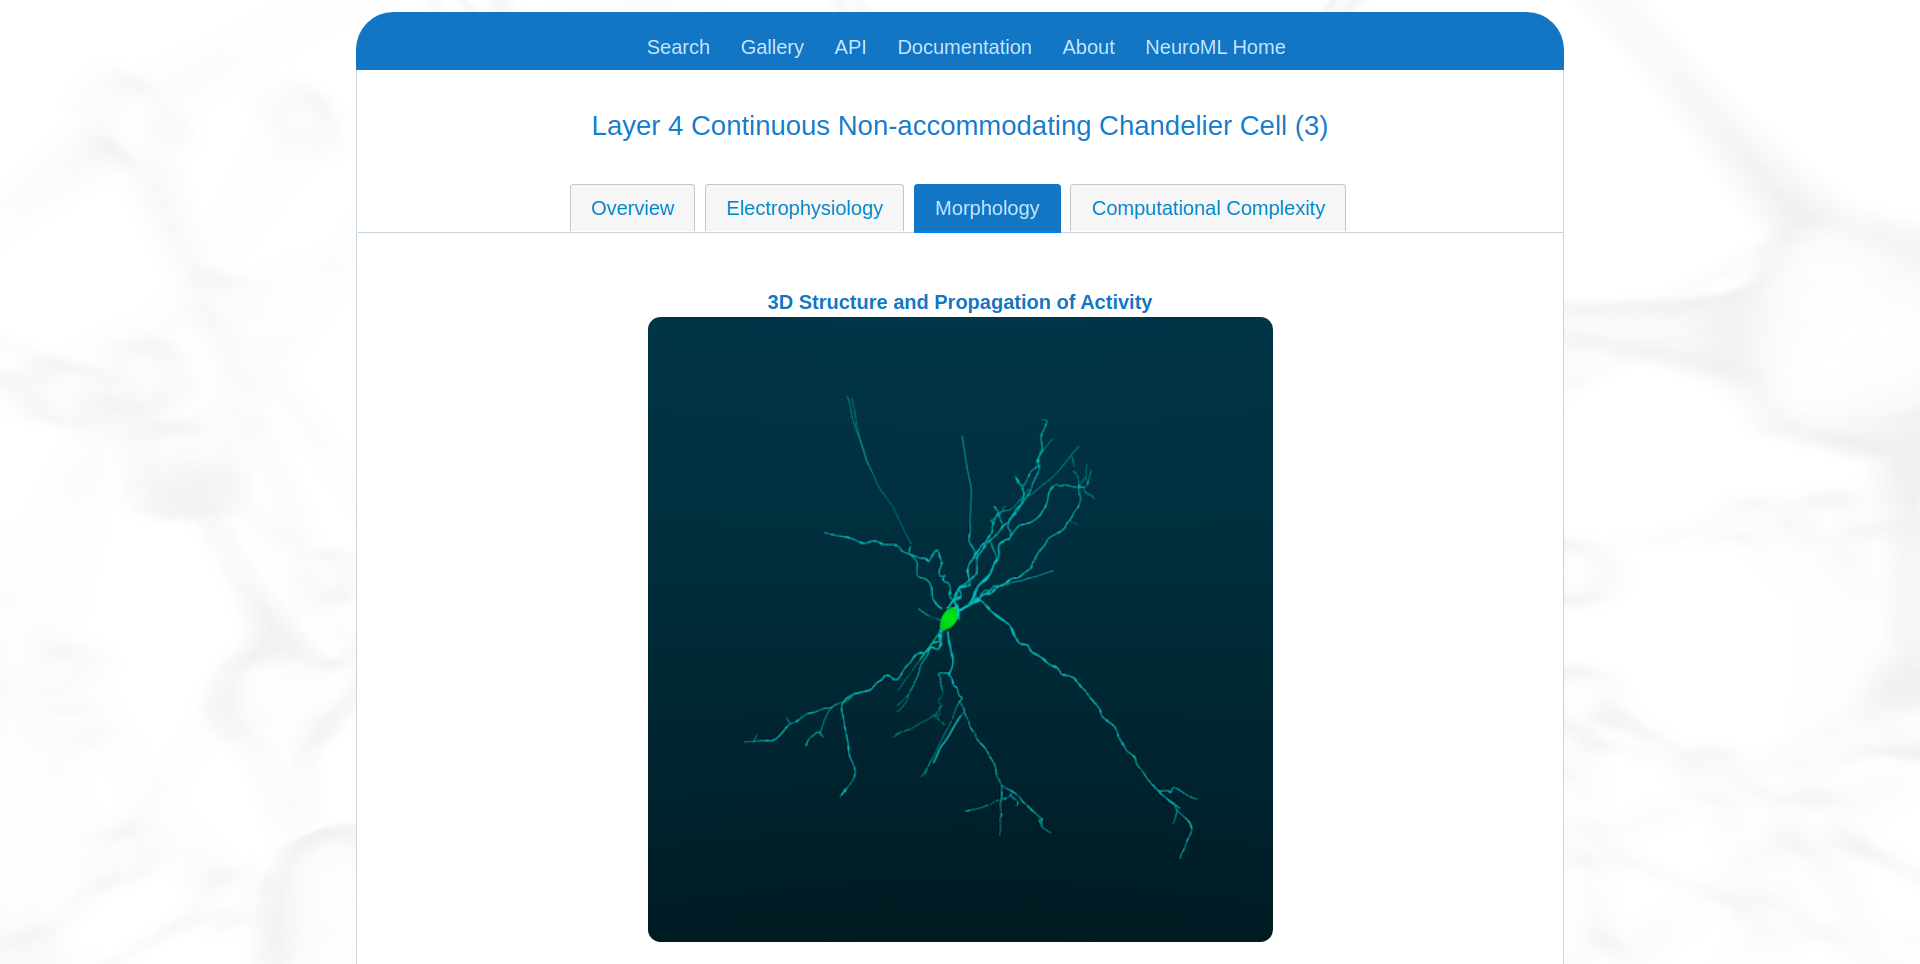
Fig. 38 Visualisation of morphology of an example cell on NeuroML-DB.#
Visualising morphology of multi-compartmental cell models in Open Source Brain#
The Open Source Brain platform also provides advanced visualisation capabilities that can be used to visualise the morphologies of NeuroML cells.
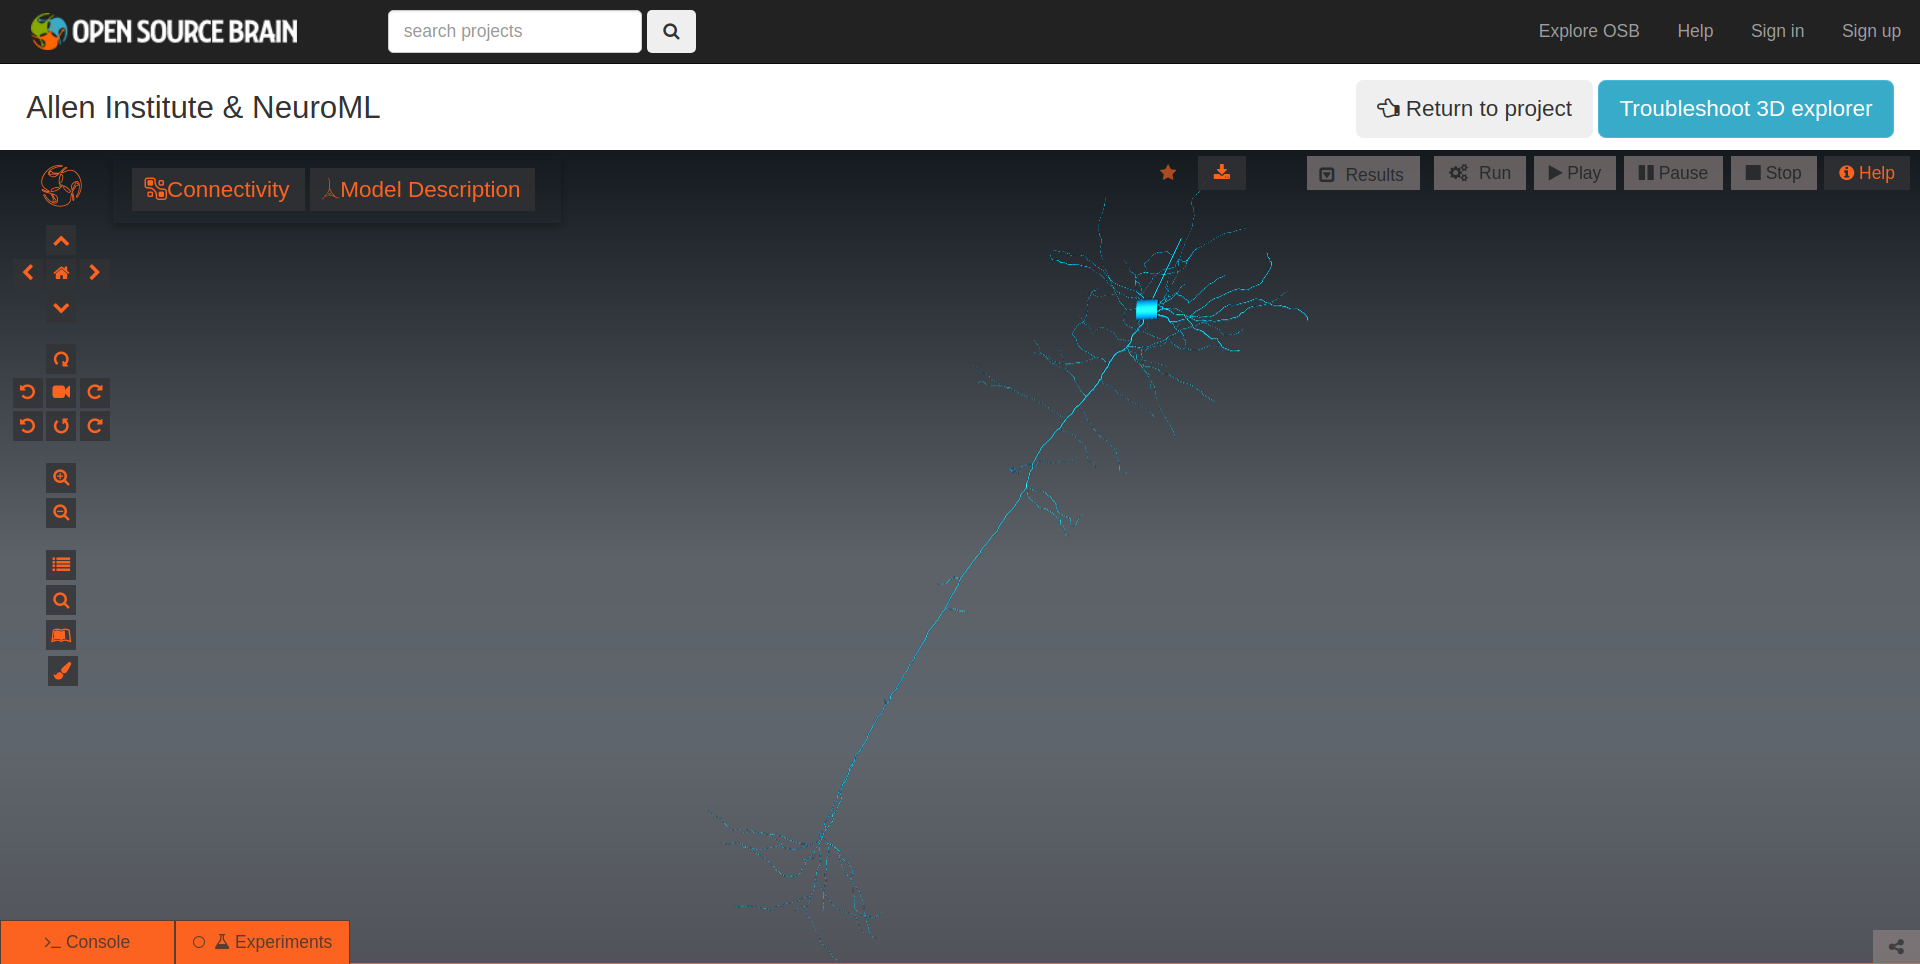
Fig. 39 Interactive visualisation of morphology of an example cell on Open Source Brain.#
Analysing cell electrophysiology#
The core tools also include utilities to aid in the analysis of cell electrophysiology. pyNeuroML includes the generate_current_vs_frequency_curve utility function that can be used to generate current-frequency, current-sub-threshold voltage, and to plot voltage traces generated at the soma for different current injections. For example, we can analyse the OLM cell from our tutorial:
generate_current_vs_frequency_curve("source/Userdocs/NML2_examples/olm.cell.nml", "olm", simulator="jNeuroML_NEURON", plot_iv=True, plot_if=True, plot_voltage_traces=True)
This will generate these figures:
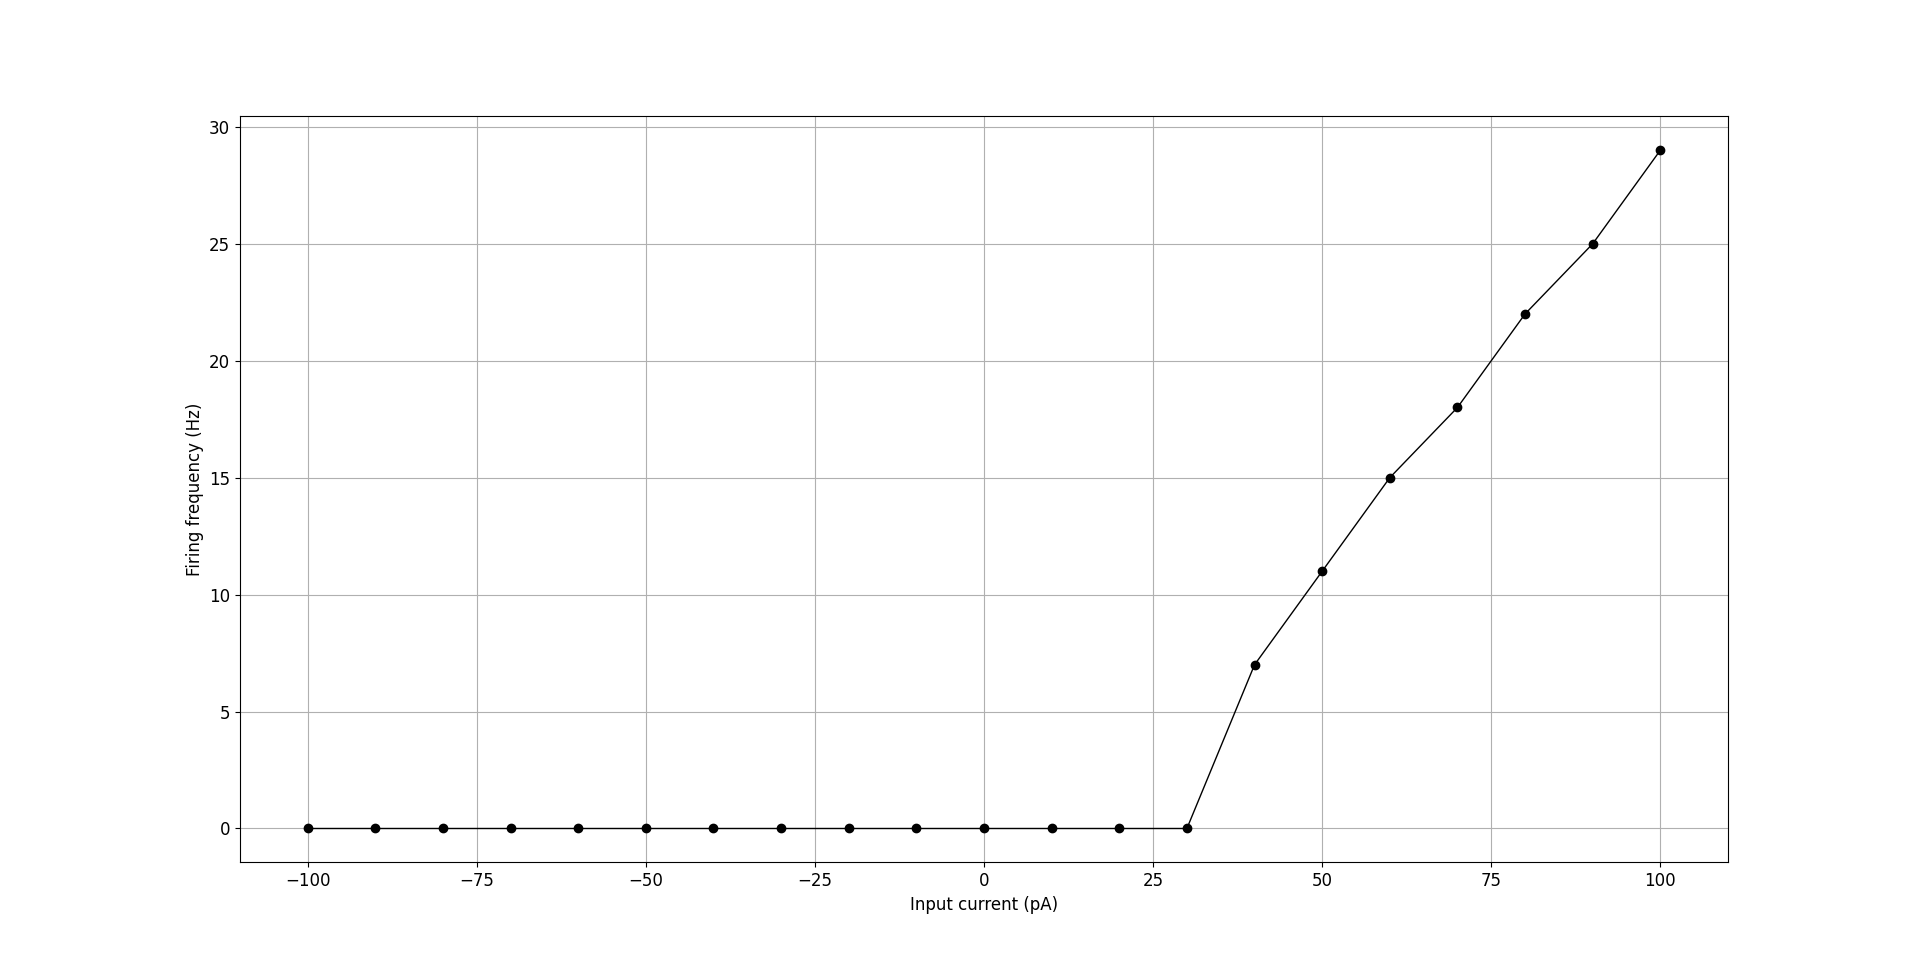
Fig. 40 F-I curve for OLM cell generated using generate_current_vs_frequency_curve.#
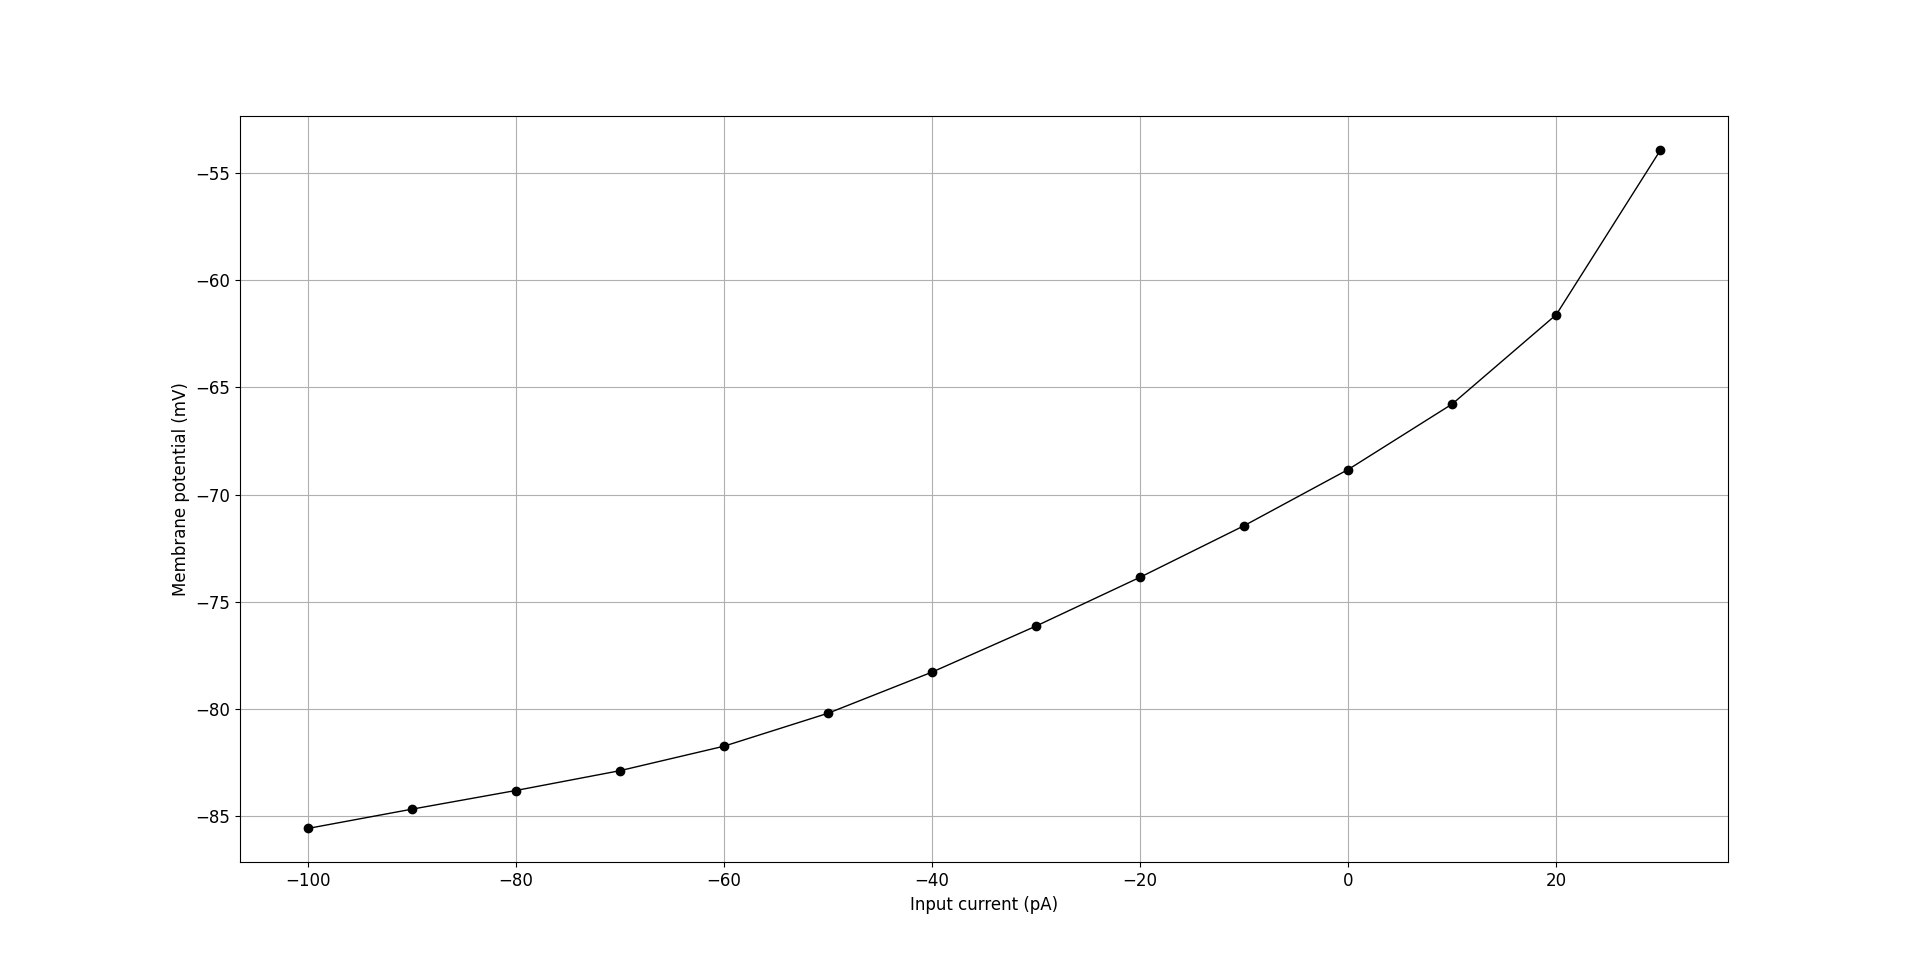
Fig. 41 Current vs sub-threshold voltage curve for OLM cell generated using generate_current_vs_frequency_curve.#
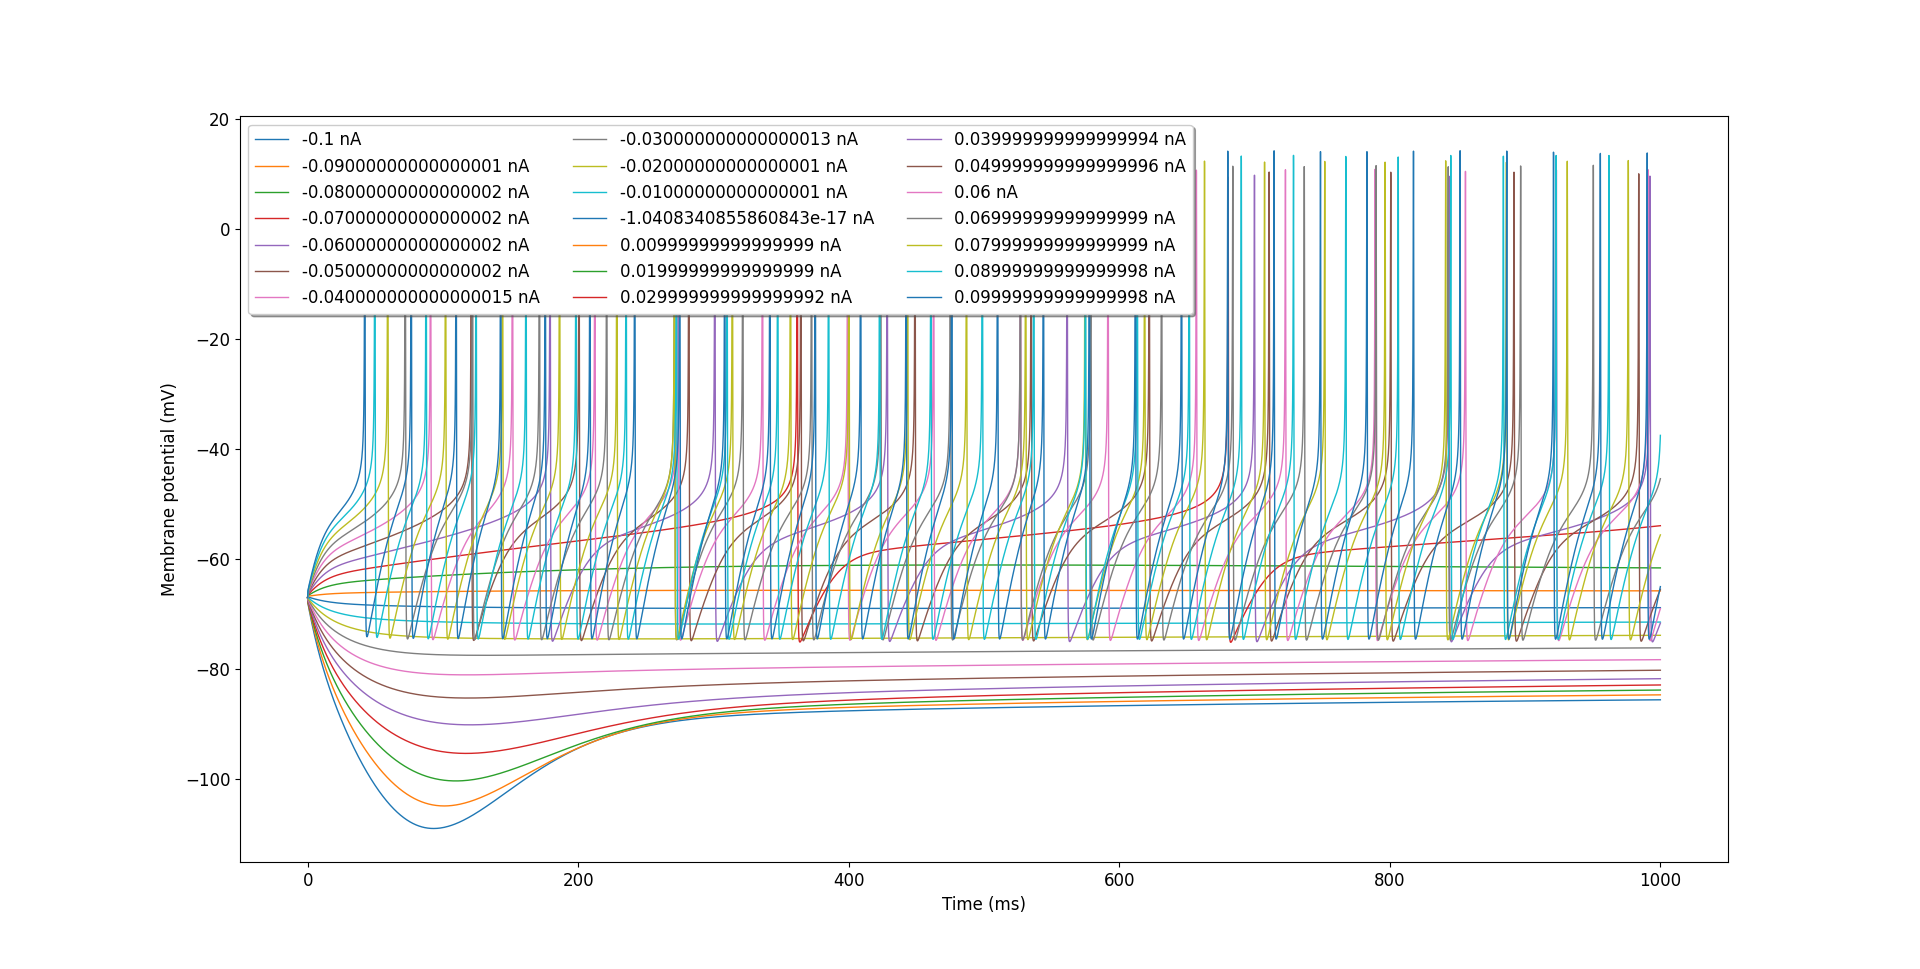
Fig. 42 Voltage traces for OLM cell with different injection currents generated using generate_current_vs_frequency_curve.#